Productivity
Purpose/Overview
In this article, you’ll learn how to use the Productivity feature to track item views and actions, page views, and time usage for your users. A Productivity Watch shows each user’s activity for a single day, including points earned and unproductive time, so you can see how work is being done and when. You can also open a detailed report and export it in several file formats. It is intended for managers, supervisors, and administrators who need visibility into user activity and workload.
Navigation Path:
To access this feature: Analytics > Productivity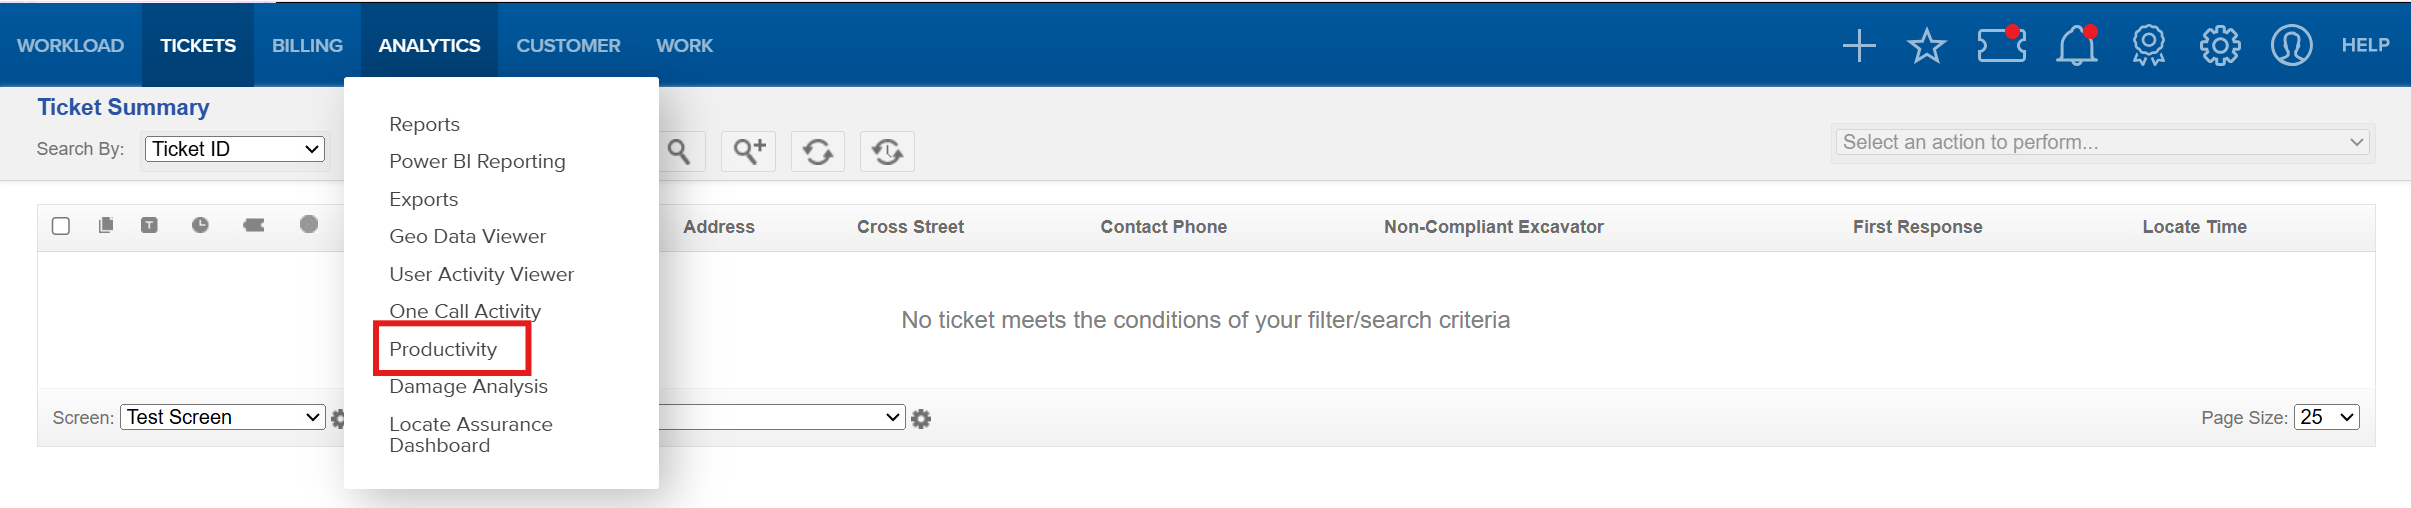
Things to Know:
- One day at a time: You can view only one day at a time in a Productivity Watch.
- Search scope: Search finds users only in the current Productivity Watch. To find a different Productivity Watch, use the filter.
- Modify button: If there is no Modify button, click Apply Filter in the left column to make it appear.
- Timeline content: The actions and views that appear on the timeline vary based on user behavior. Use Timeline Display to choose which ones to show.
- Unproductive time: This is the percentage of time a user spent not viewing pages or items (or taking actions on them) between their first and last actions in a day. The unproductive time threshold defines the shaded periods on the timeline.
- Export formats: The Details report can be exported in several formats (see the table in How It Works).
Key Benefits/Use Cases:
- Daily activity review: A supervisor reviews a user’s day to see page views, item views, and actions in chronological order. This gives a clear picture of how time was spent and supports coaching conversations.
- Identifying unproductive time: A manager checks the shaded unproductive periods on the timeline to spot gaps between a user’s first and last actions of the day. This helps identify workflow or workload issues.
- Reporting and analysis: An analyst opens the Details report for a date range and exports it to Excel, CSV, PDF, or another format for further analysis or to share with stakeholders.
How It Works:
Find a Productivity Watch
- Open Productivity. On the top menu bar, click Analytics > Productivity. The User Productivity page appears.
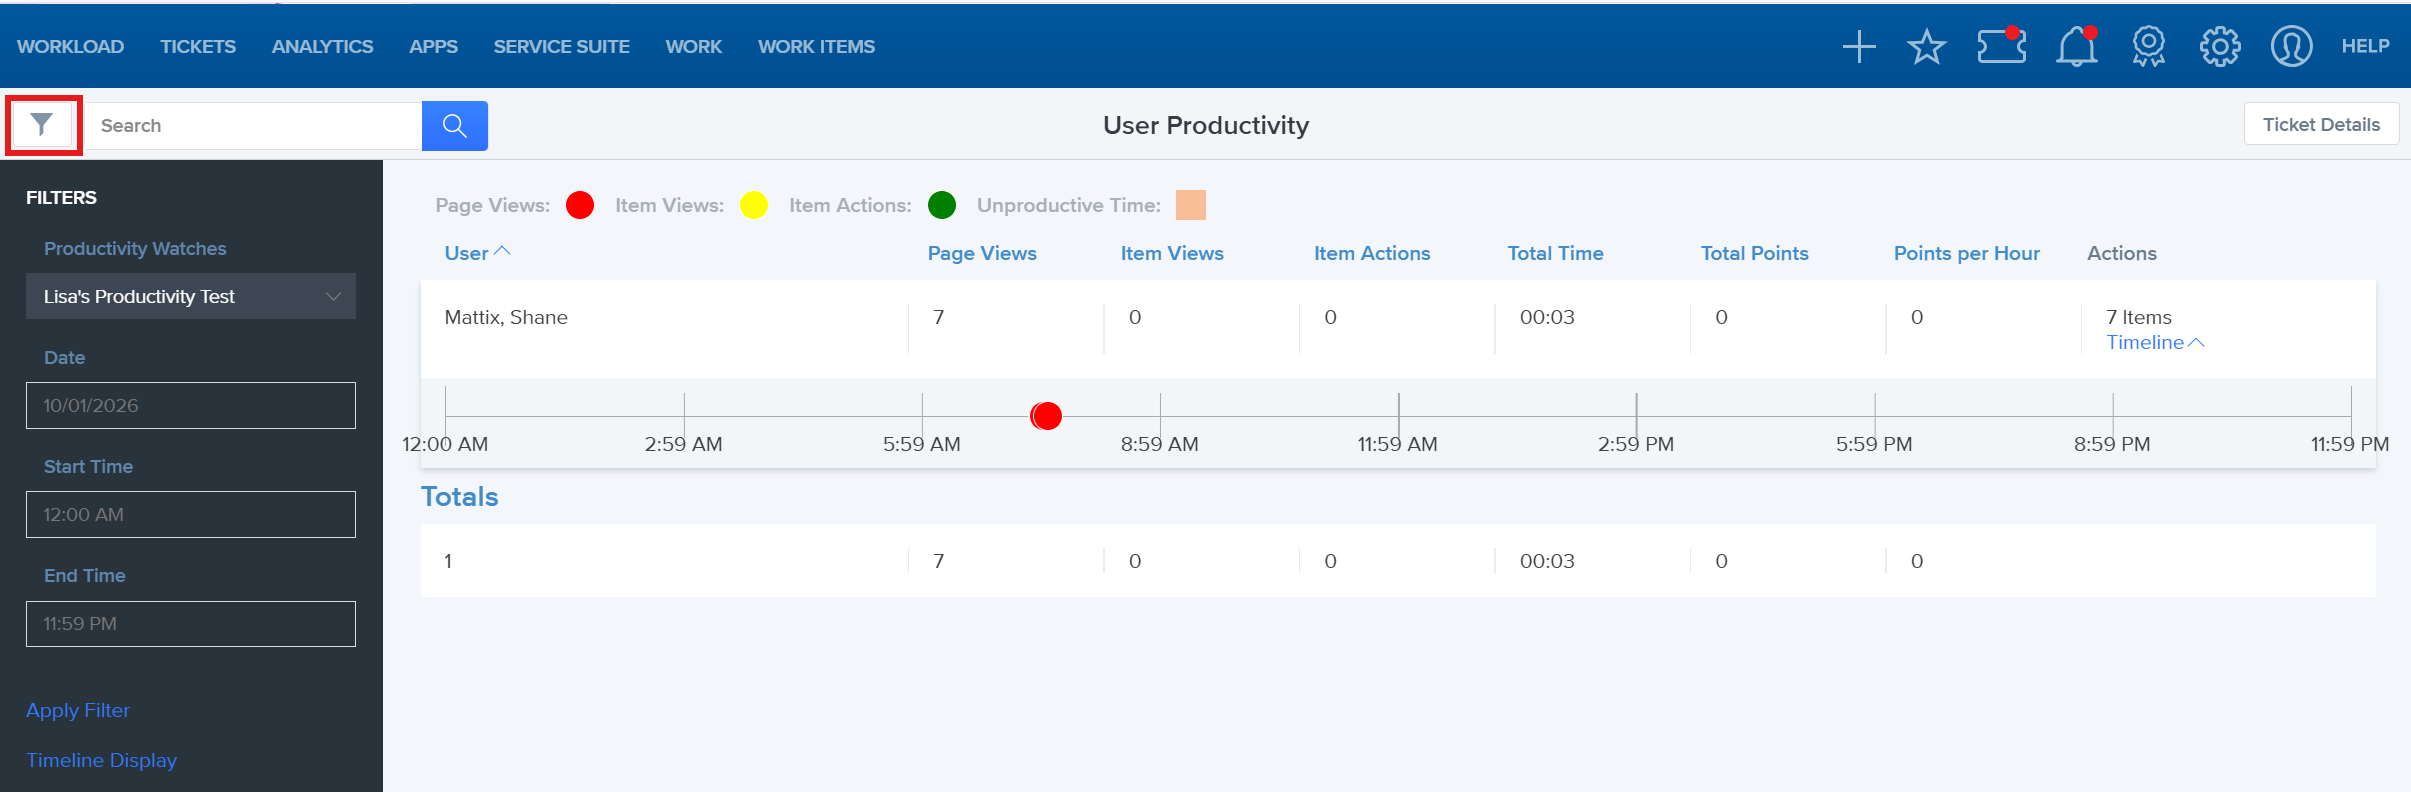
- Show the filters. If you don't see filters on the left side of the screen, in the upper-left corner, click Filter. The Filter column appears. Click Filter again to hide it.
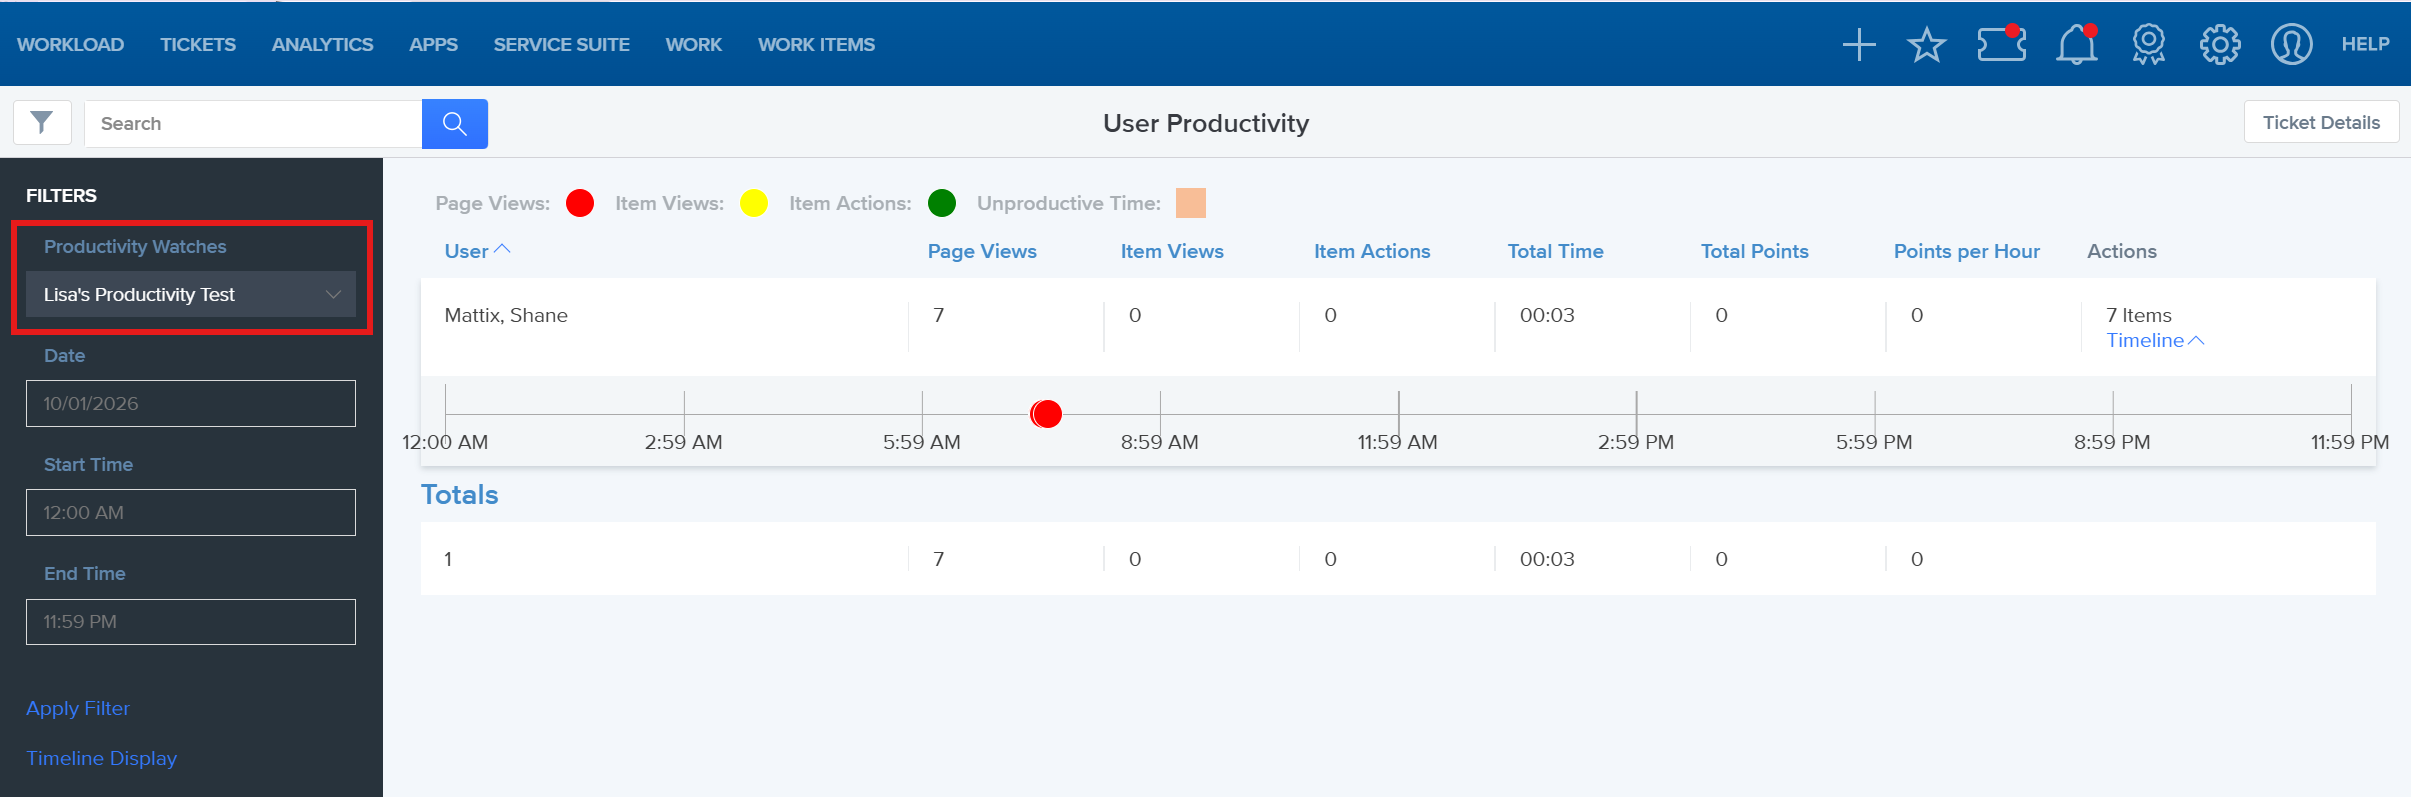
- Choose a Productivity Watch. In the Productivity Watches dropdown, choose a filter. Then choose a date and the start and end time. You can view only one day at a time.
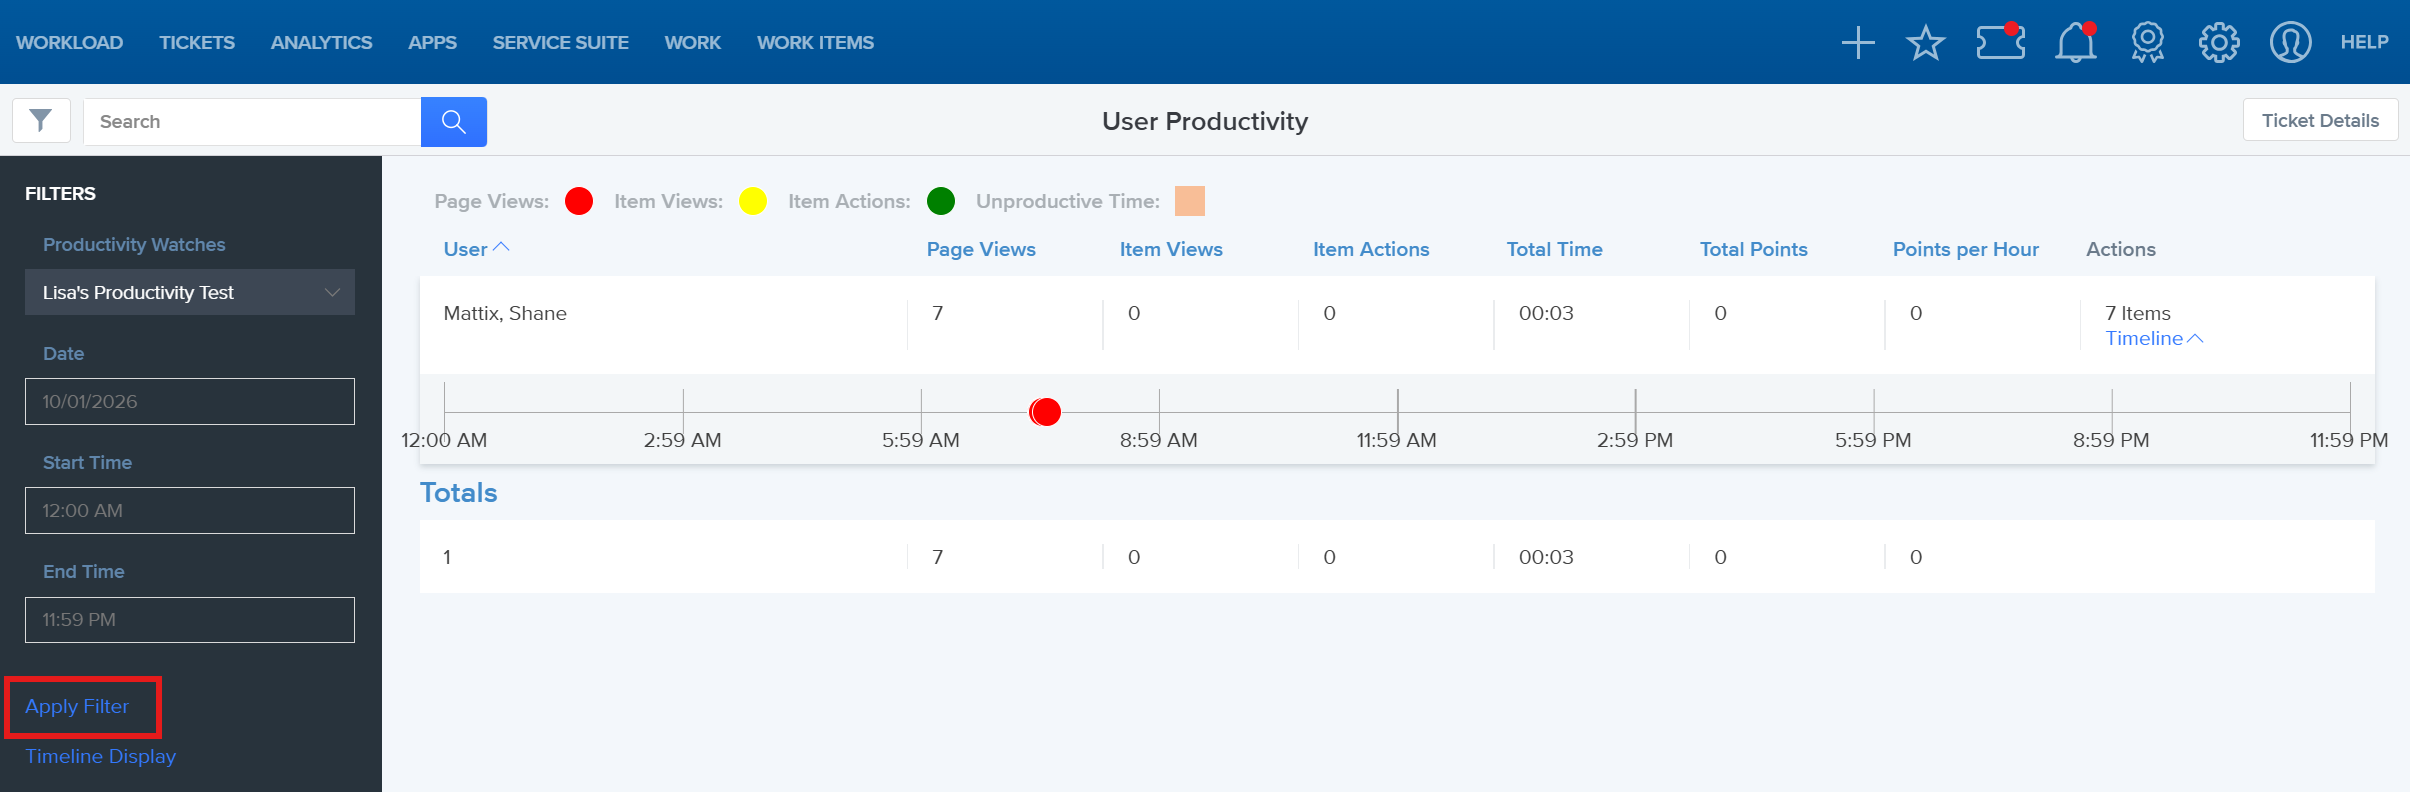
- Apply the filter. At the bottom of the Filter column, click Apply Filter. The Productivity Watch appears, with Modify in the upper right corner.
Search for a user
You can search for users only in the current Productivity Watch.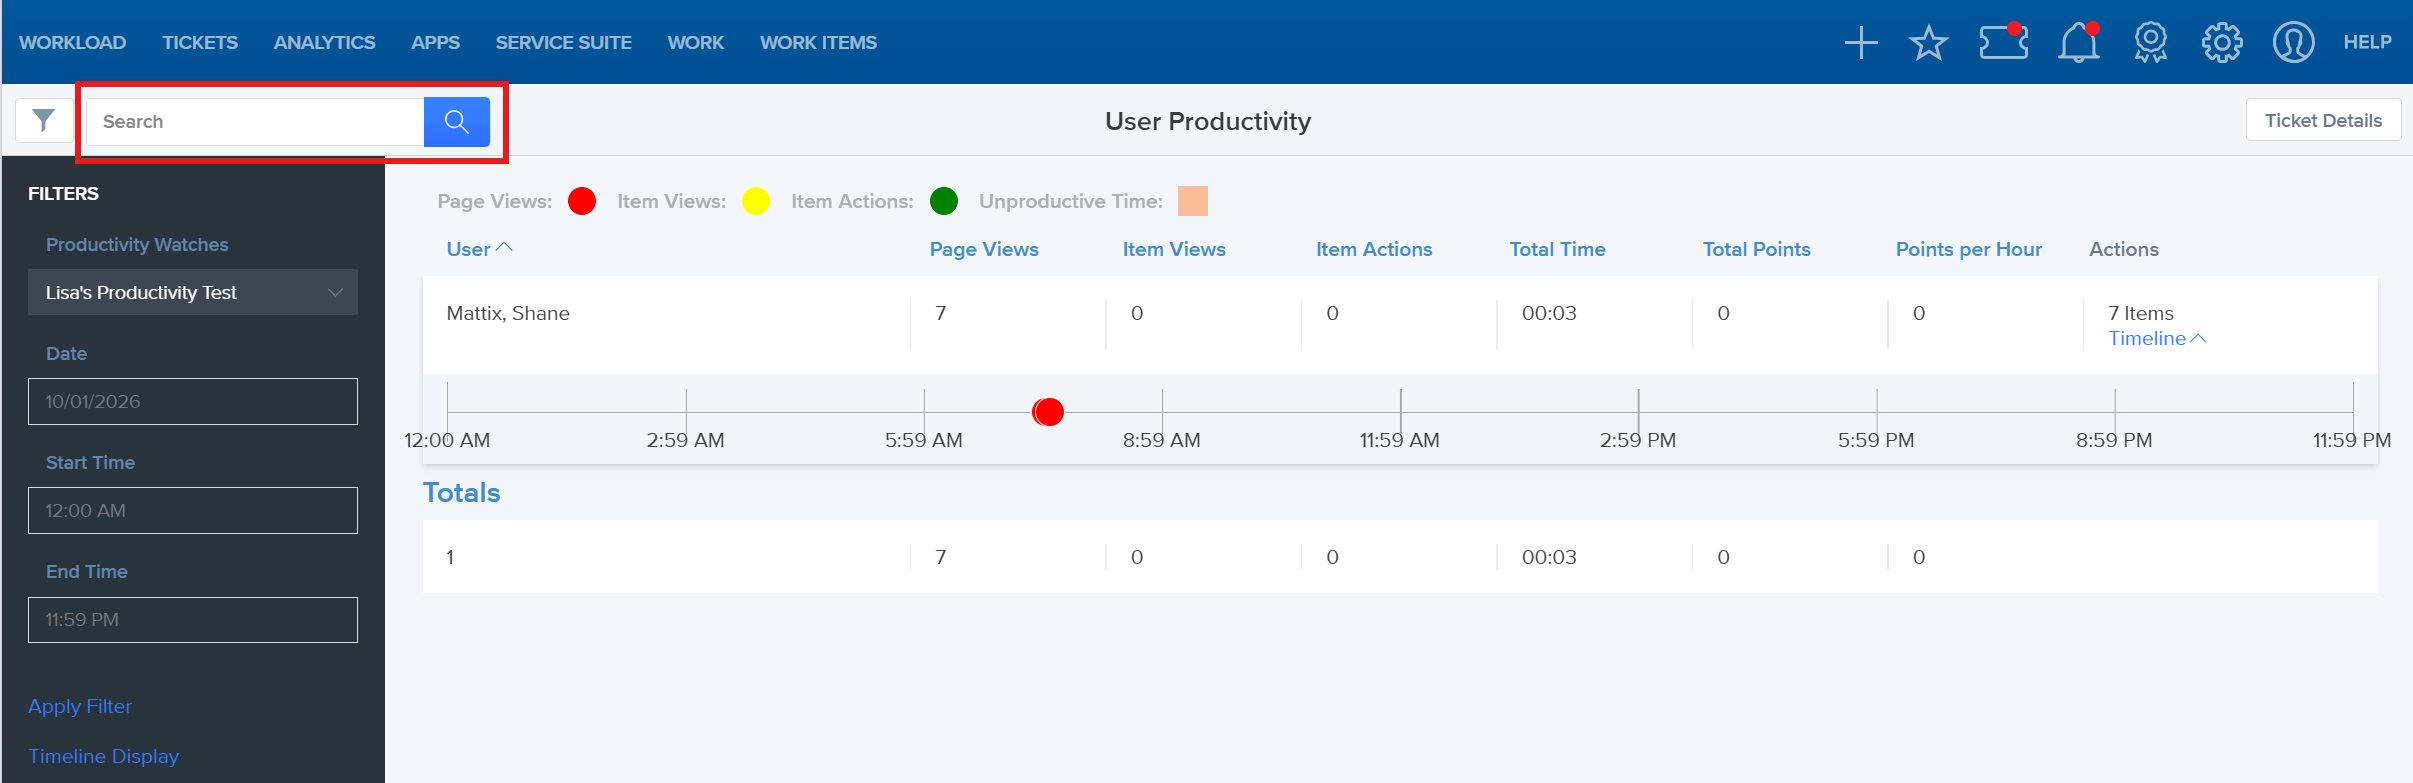
- In the upper-left corner, type your search in the search box.` !Z@CFRVX#$%`
- Click Search. The search results appear.
- Optional: To erase the search term and results, click X.
View actions and views on the timeline
The timeline shows each user’s actions and items in chronological order for a given day.
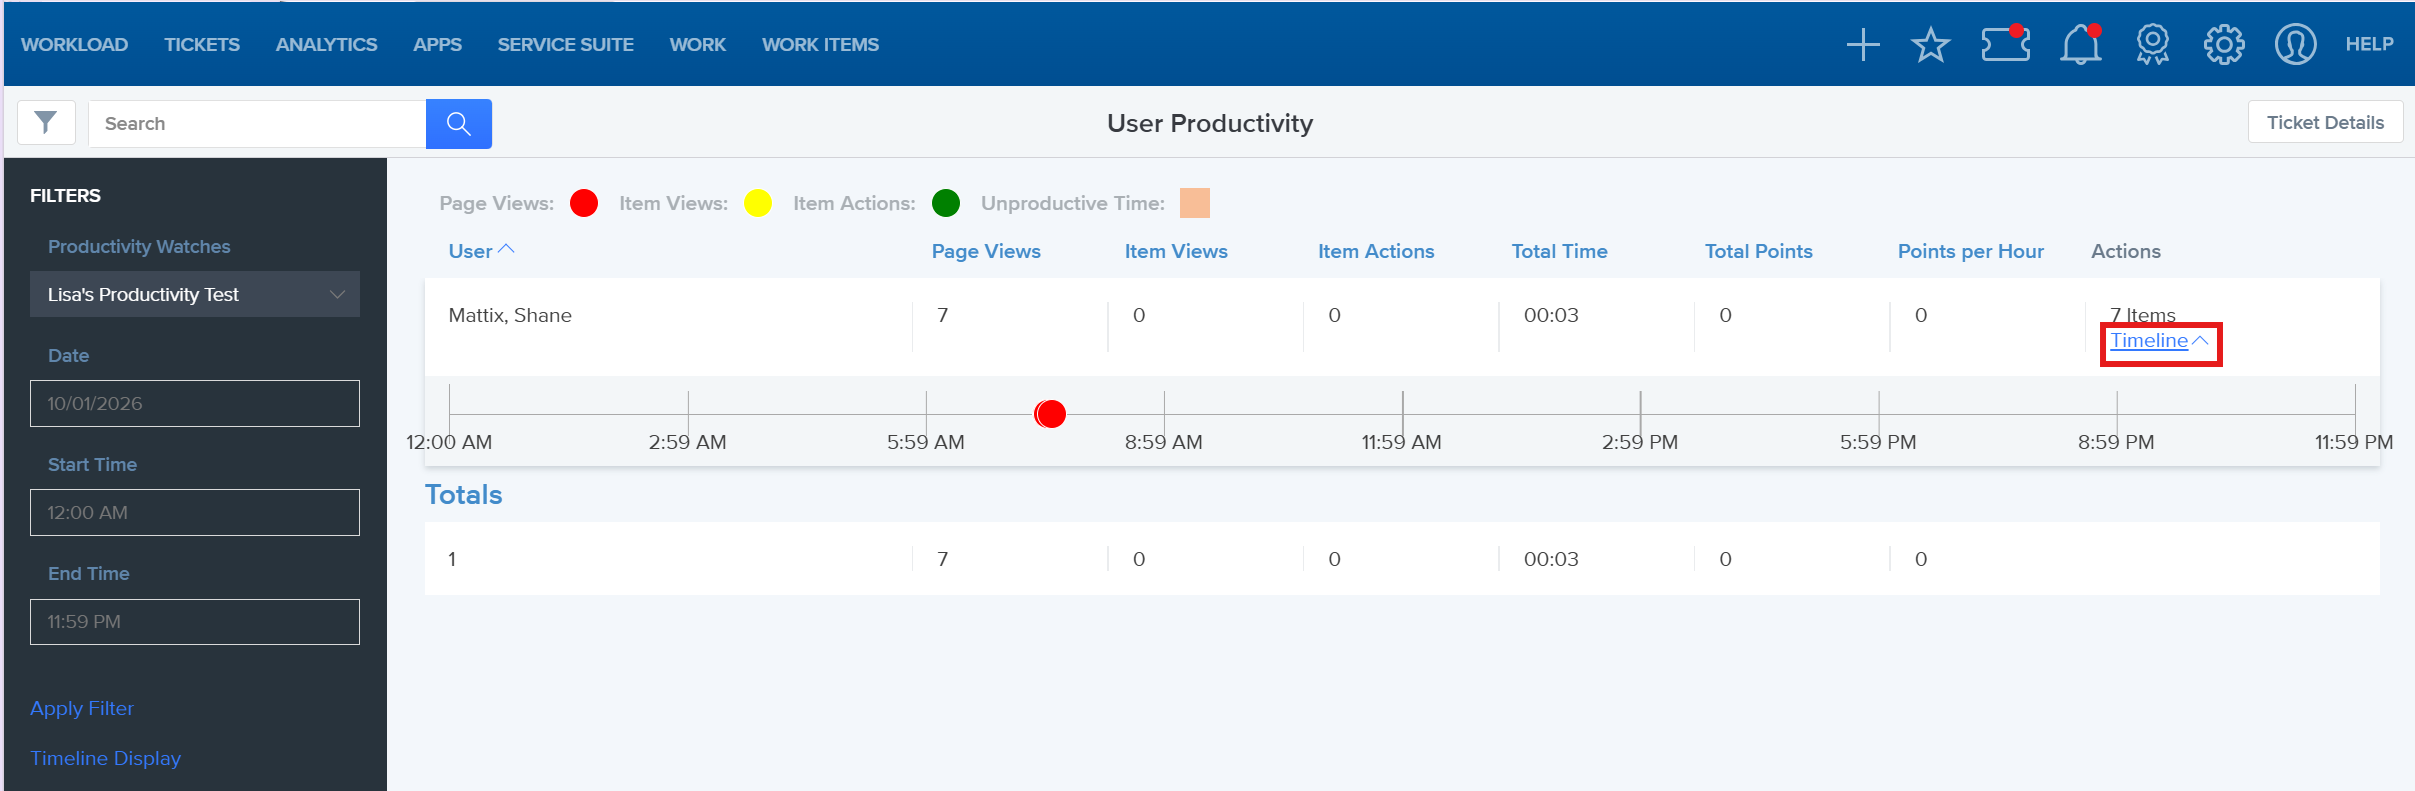
- At the end of a user row, click Timeline to show or hide the timeline.
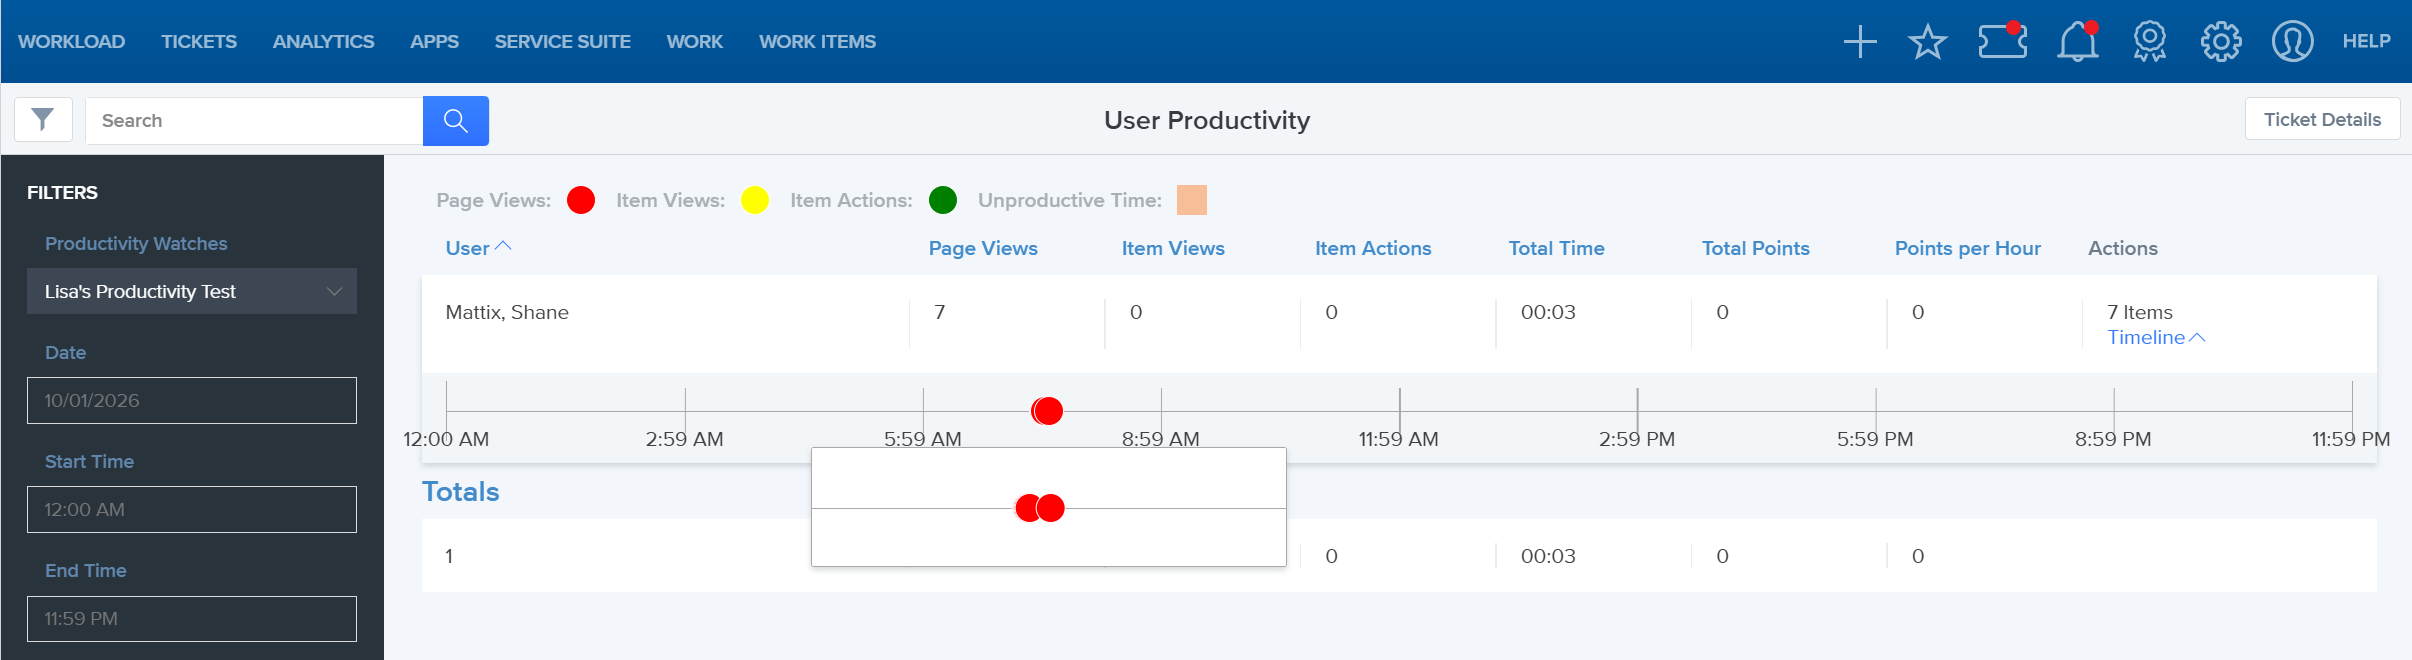
- In the timeline, put the cursor on a colored circle. A window appears showing the action or item circle in a larger (zoomed-in) view.
In that window, put the cursor on the item or action circle. Another window appears with these details: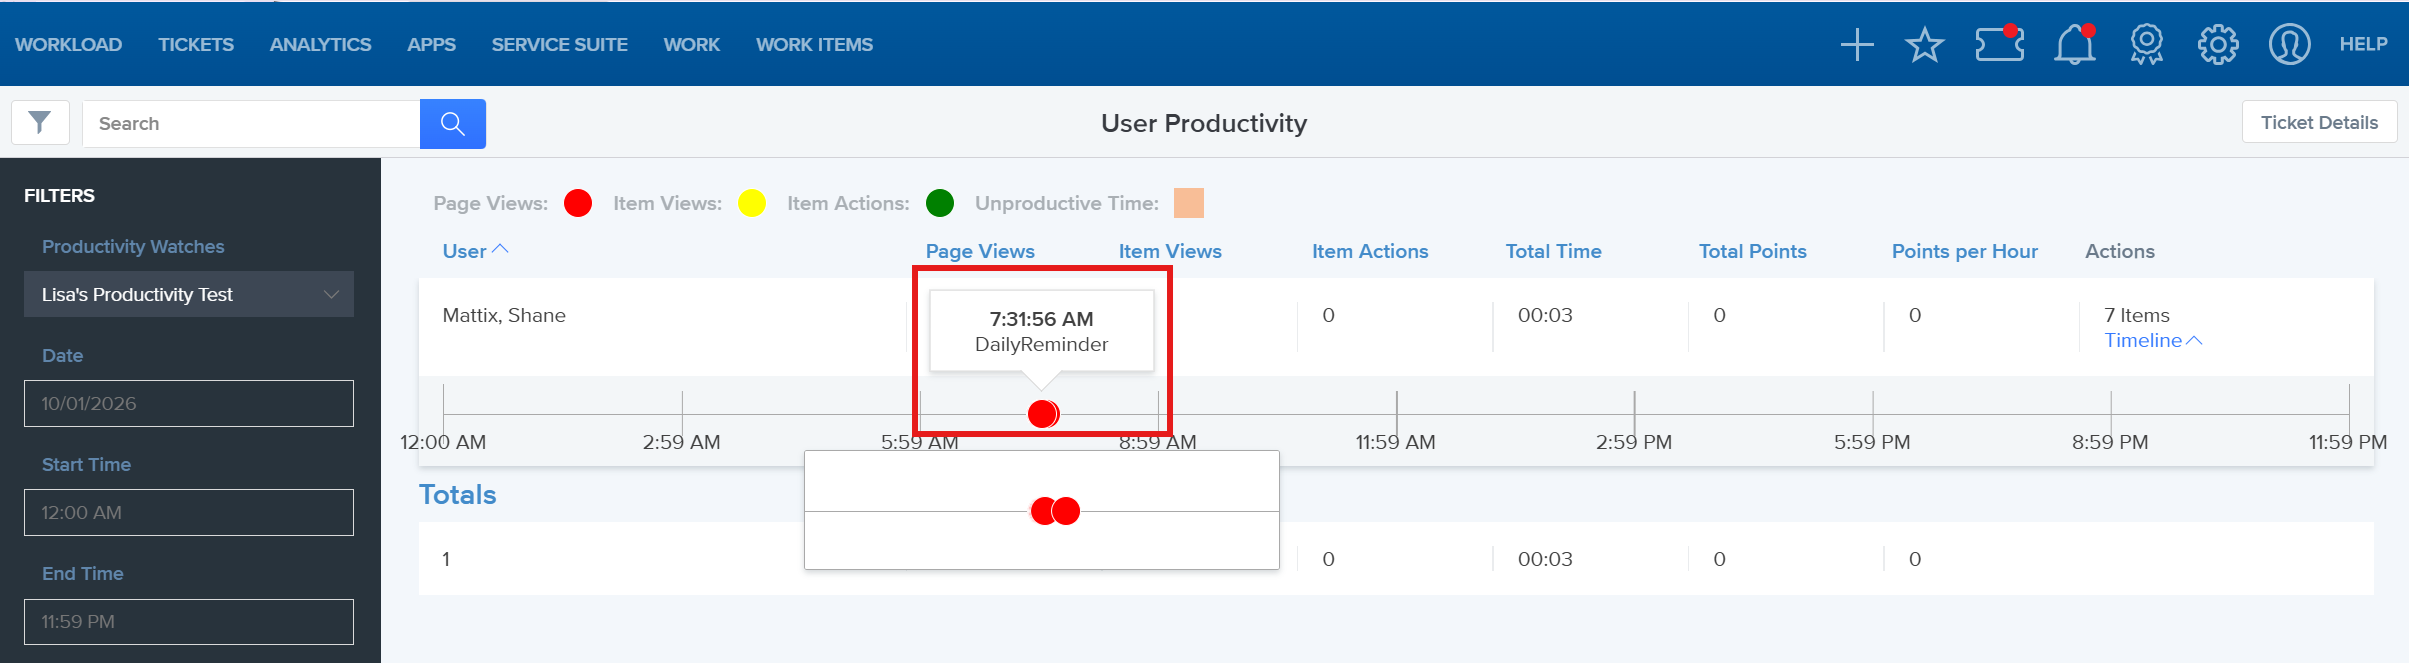
- Time of view or action
- Name of the page or action
- ID number of the ticket or item the action was performed on
- Optional: Click the ID number of the ticket or item to view it in a new browser tab or window.
Change which actions and views display on the timeline
- In the left column, at the bottom, click Timeline Display.
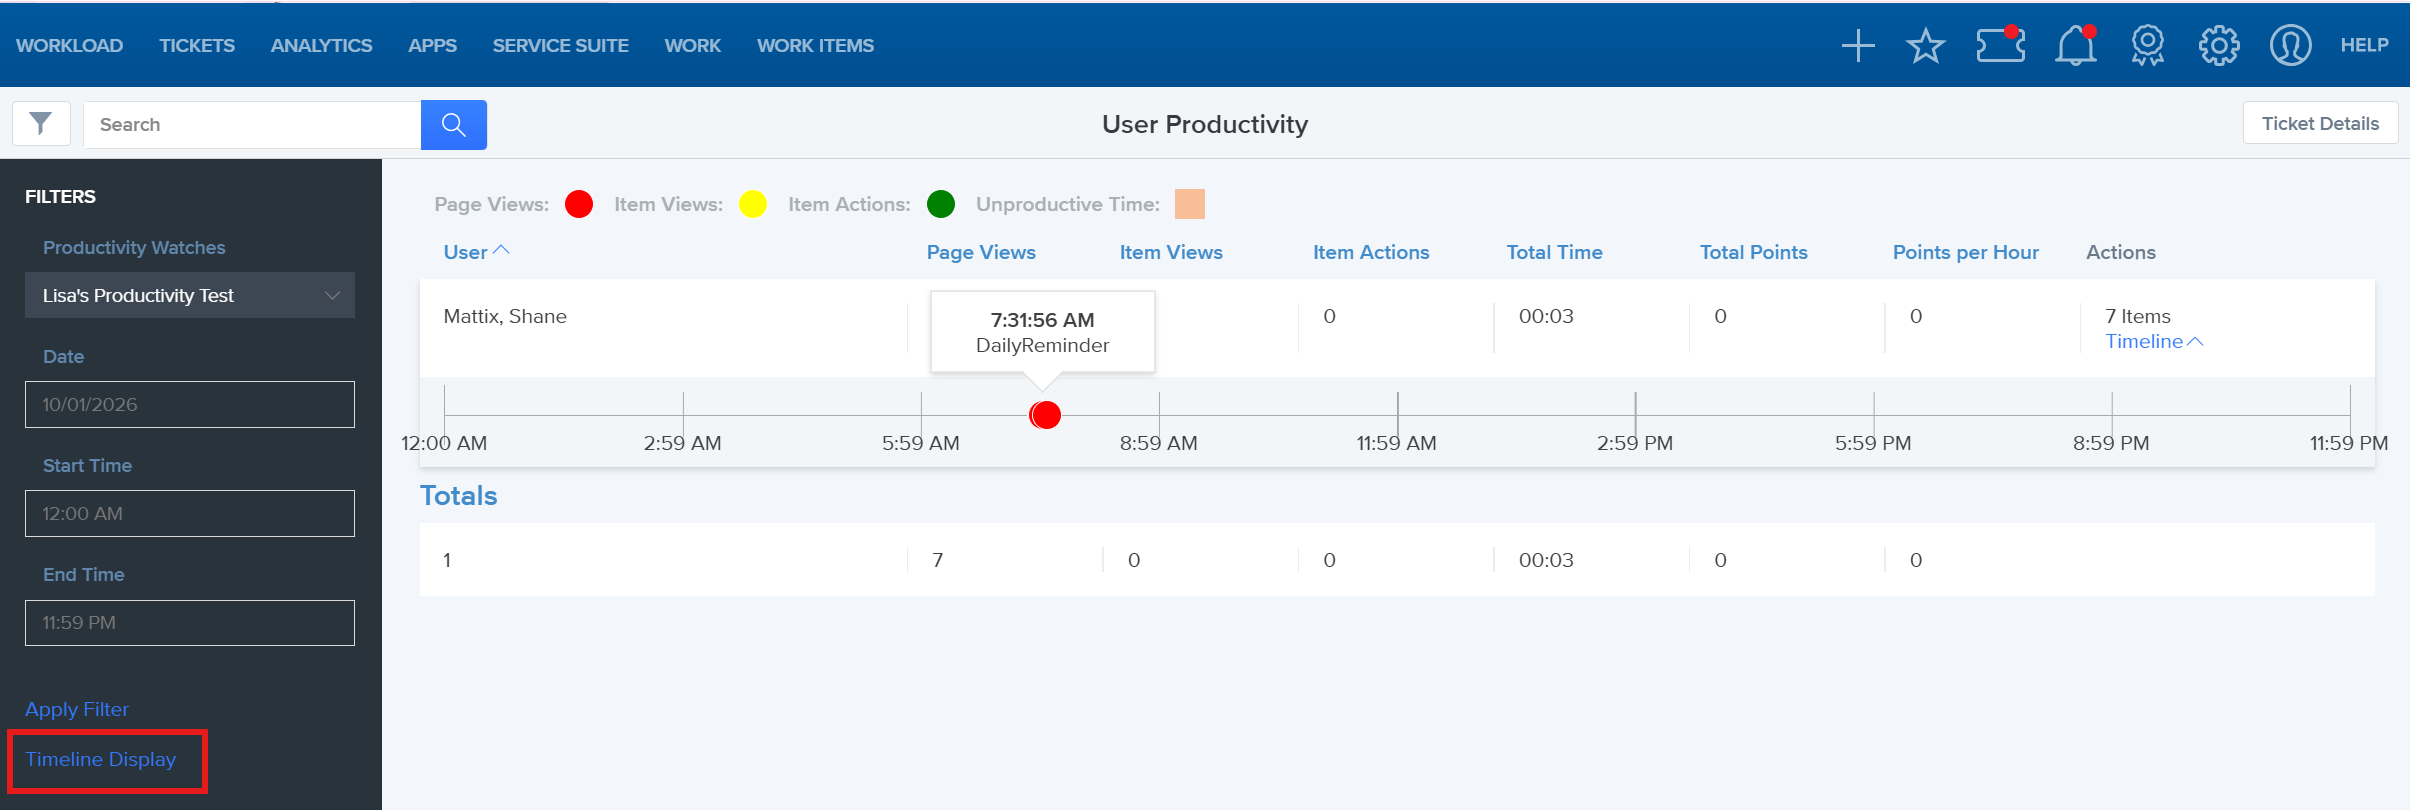
- In the Timeline Display window, check or uncheck the boxes to add or remove actions or views from the timeline.
- Click Done.
View and download the Ticket Details report
Use Details to view and download a detailed report of productivity data.
- In the upper right corner, click Ticket Details.

- In the Summary of Productivity window, choose the date range of the data.
- Click View Report. The productivity analysis data appears in a table.

- In the report, use any of these actions:
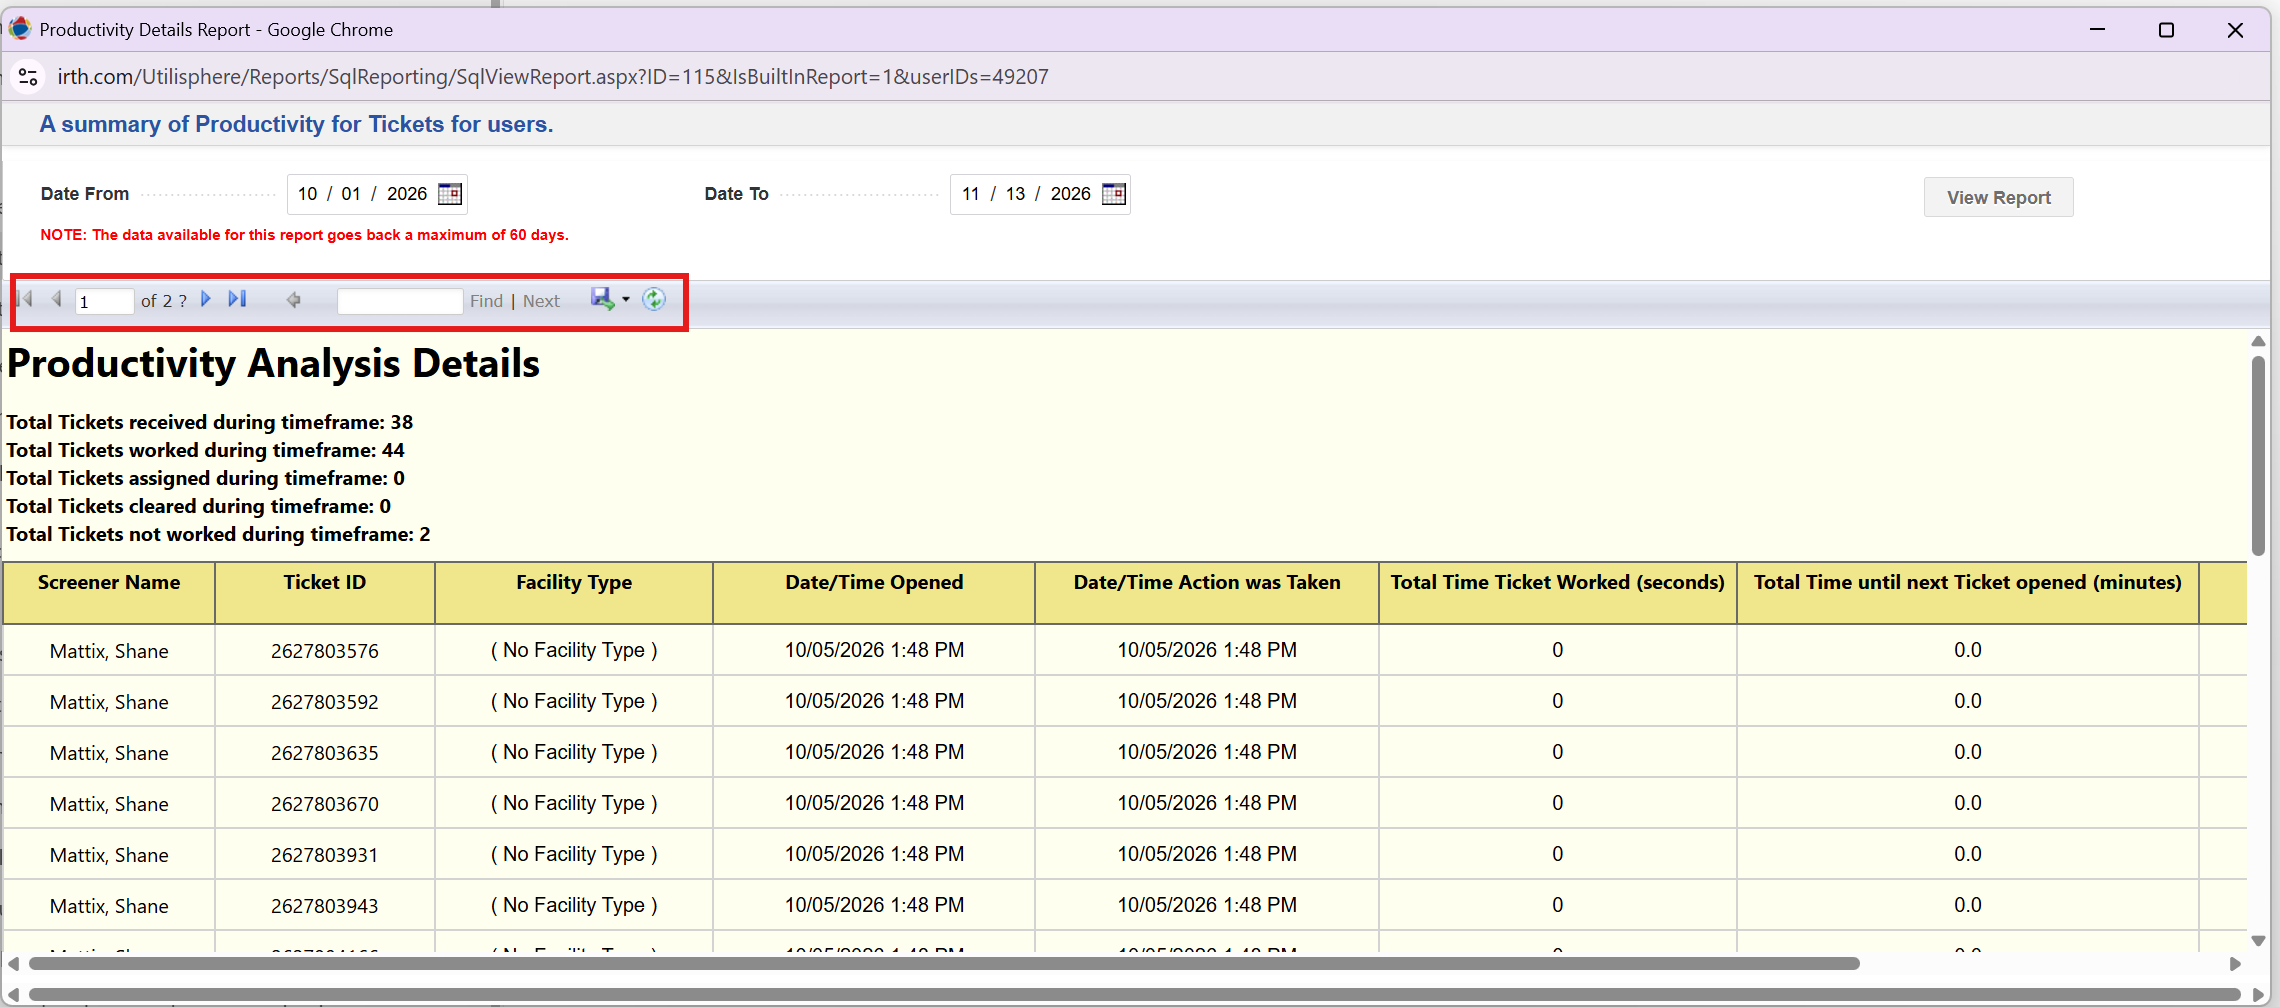
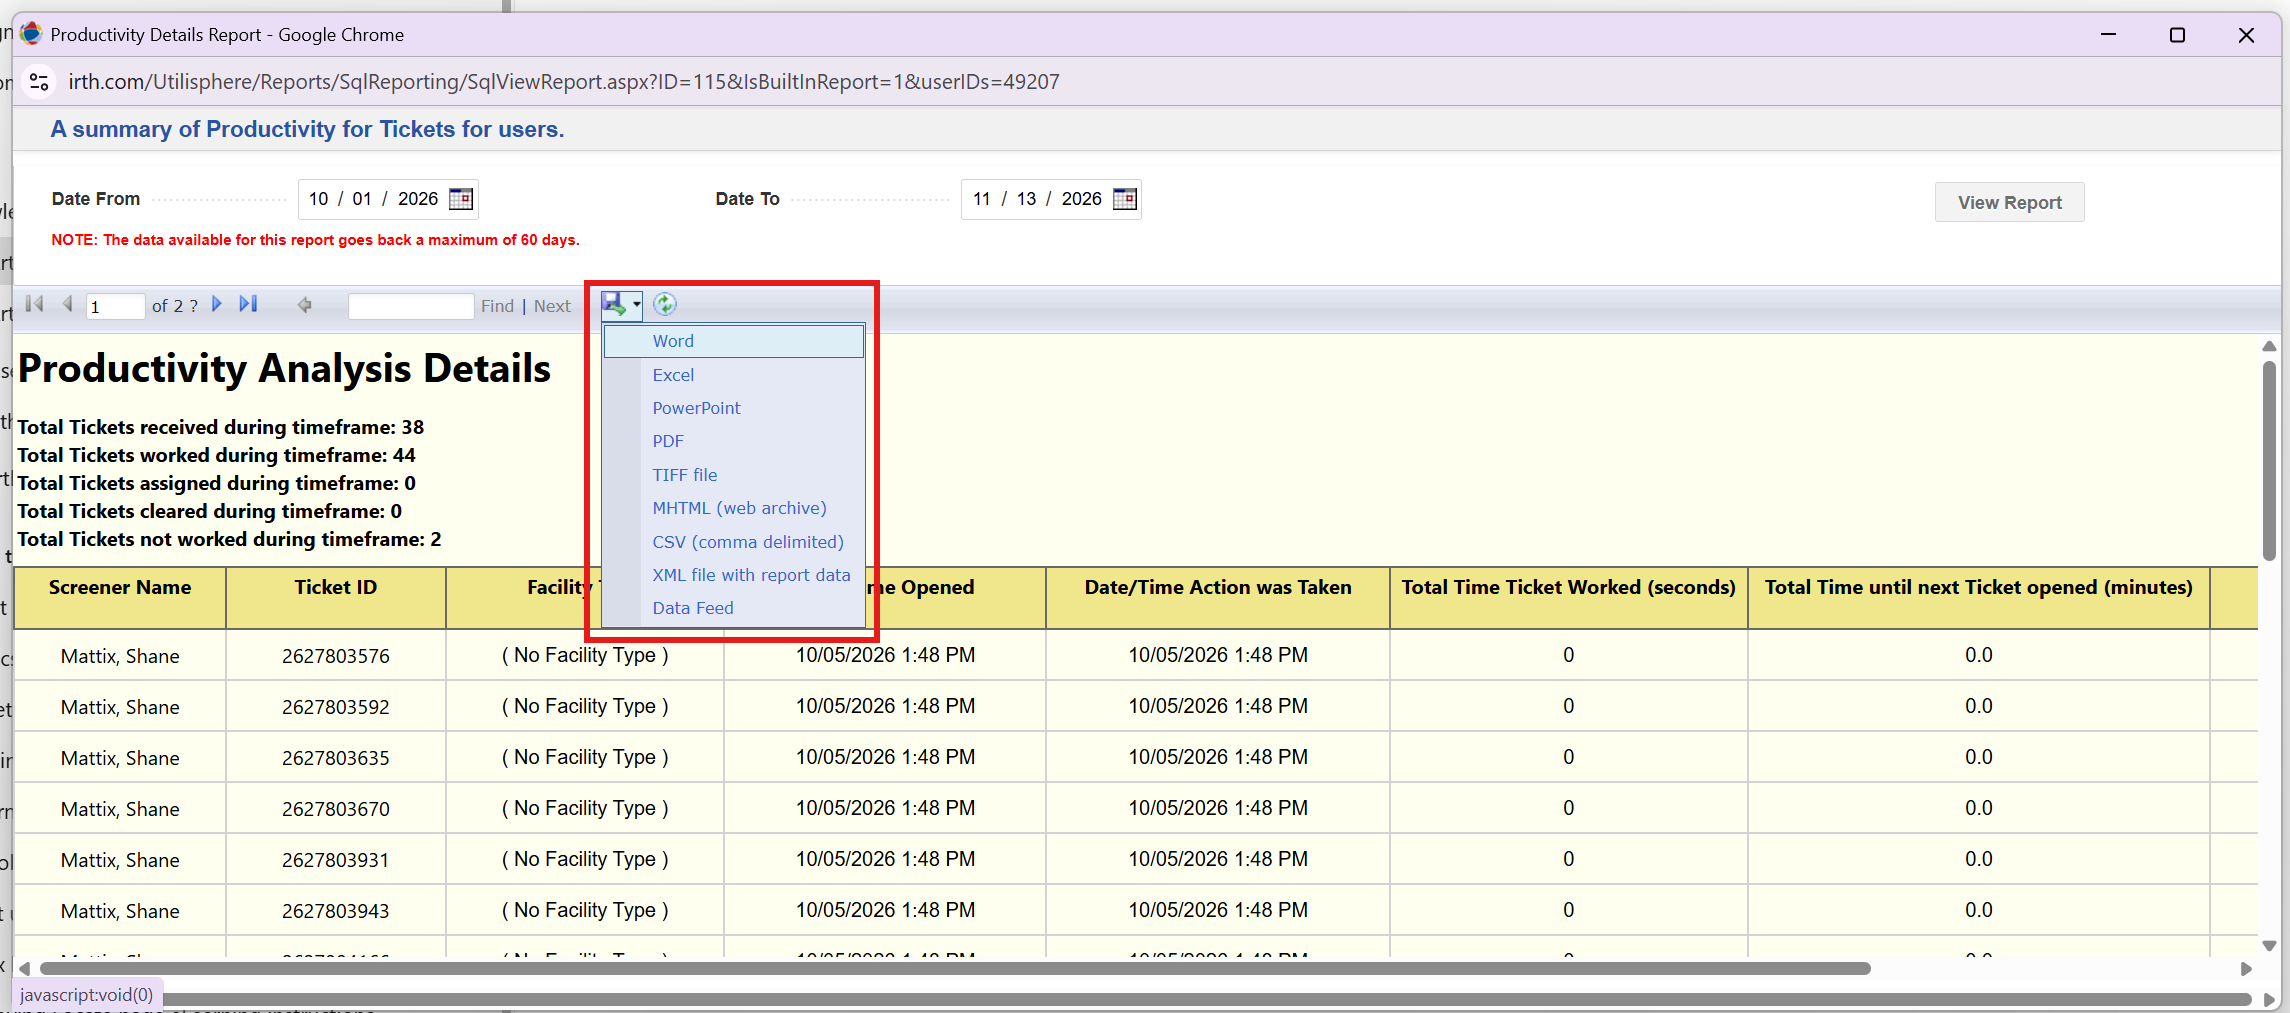
Action Description Find (search) Type your search term in the search box to see if it occurs in the report. Page Use the arrows to move back and forward page by page. Refresh Generates a new report based on the fields you chose. Export (save) Saves the report in one of the formats below. - Export in your desired format.
FAQ/Troubleshooting:
Q: Why can’t I find a user when I search?
A: Search finds users only in the current Productivity Watch. If the user isn’t in the watch you are viewing, use the filter to choose a different Productivity Watch, then search again.
Q: Why don’t I see the Modify button?
A: Click Apply Filter at the bottom of the Filter column. The Productivity Watch appears and the Modify button displays in the upper right corner.
Q: Can I view more than one day at a time?
A: No. A Productivity Watch shows one day at a time. To review a longer period, use Details and choose a date range in the Summary of Productivity window.
Q: Why is a certain action or view missing from the timeline?
A: The actions and views shown vary based on user behavior, and you control which ones display. Click Timeline Display in the left column and check the boxes for the actions or views you want, then click Done.
Q: What does the shading on the timeline mean?
A: It marks unproductive time, as defined by the unproductive time threshold. This is the percentage of time a user was not viewing pages or items (or taking actions on them) between their first and last actions of the day.
Q: How do I open the ticket or item shown on the timeline?
A: Put the cursor on the circle until the details window appears, then click the ID number. The ticket or item opens in a new browser tab or window.
Q: Which file formats can I export the report to?
A: CSV, Data Feed (.atomsvc), Excel, MHTML, PDF, PowerPoint, TIFF, Word, and XML.
Questions? Contact us!

Was this article helpful?
That’s Great!
Thank you for your feedback
Sorry! We couldn't be helpful
Thank you for your feedback
Feedback sent
We appreciate your effort and will try to fix the article